ggplot2 v3.1.0 will be released soon (hopefully), so let me do a spoiler about a small feature I implemented, geom_sf_label() and geom_sf_text().
How can we add label/text with geom_sf()?
geom_sf() is one of the most exciting features introduced in ggplot2 v3.0.0. It magically allows us to plot sf objects according to their geometries’ shapes (polygons, lines and points).
But, for plotting them as some other shapes than the original ones, we cannot rely on geom_sf() so it needs a bit of data transformation beforehand. Suppose we want to add text on each geometry, we need to
calculate the proper point to add text/labels per geometry by some function like sf::st_centroid() and sf::st_point_on_surface(),
retrieve the coordinates from the calculated points by sf::st_coordinates(), and
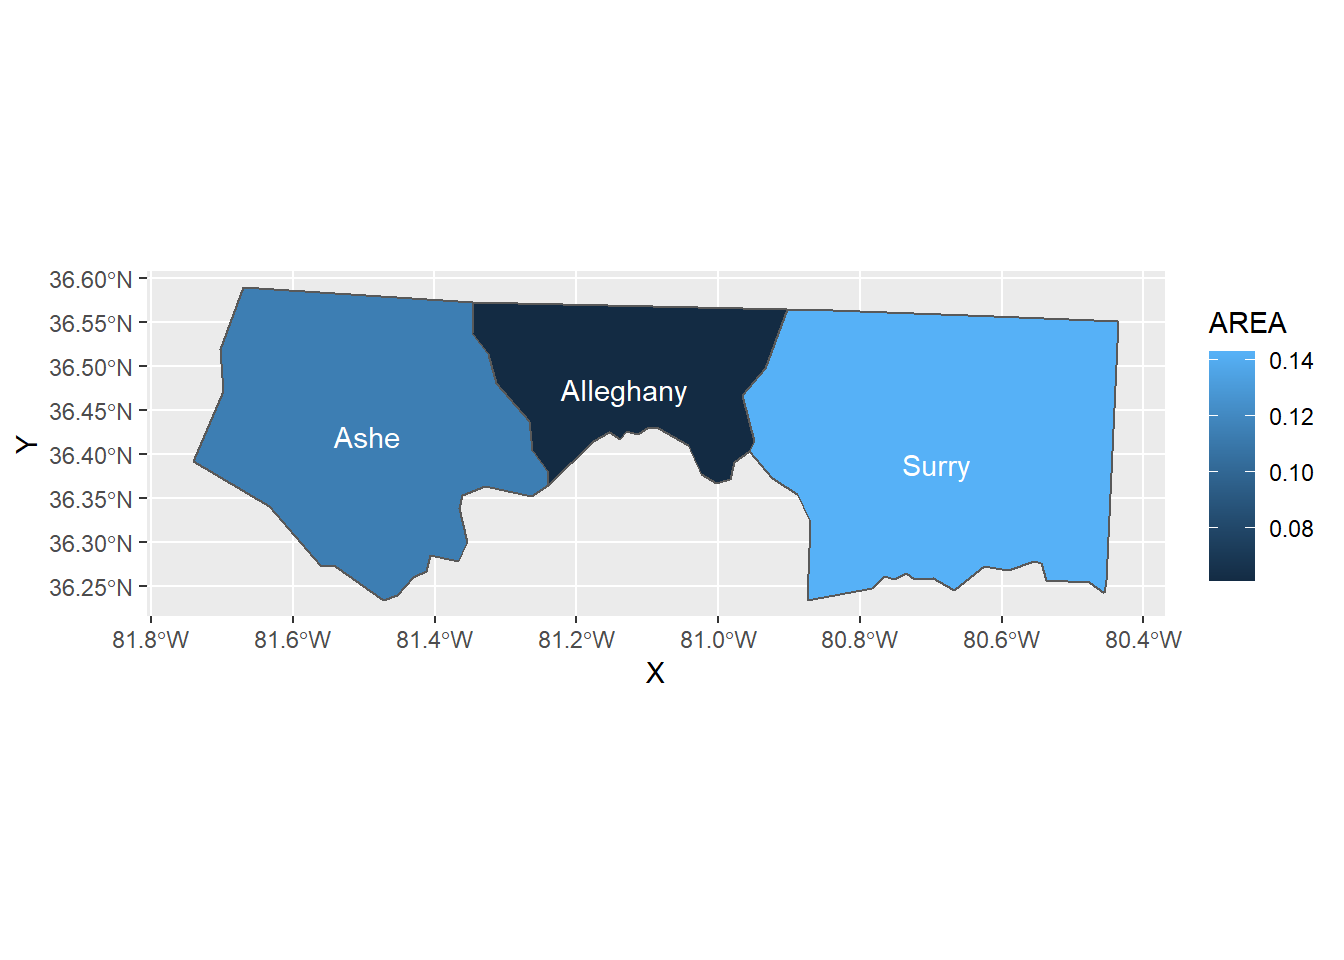
use geom_text() or geom_label() with the coordinates
The code for this would be like below:
library(ggplot2)nc <- sf::st_read(system.file("shape/nc.shp", package ="sf"), quiet =TRUE)# use only first three elementsnc3 <- nc[1:3, ]# choose a point on the surface of each geometrync3_points <- sf::st_point_on_surface(nc3)
Warning in st_point_on_surface.sf(nc3): st_point_on_surface assumes attributes
are constant over geometries of x
Warning in st_point_on_surface.sfc(st_geometry(x)): st_point_on_surface may not
give correct results for longitude/latitude data
# retrieve the coordinatesnc3_coords <-as.data.frame(sf::st_coordinates(nc3_points))nc3_coords$NAME <- nc3$NAMEnc3_coords
          X        Y      NAME
1 -81.49496 36.42112      Ashe
2 -81.13241 36.47396 Alleghany
3 -80.69280 36.38828     Surry
Warning in st_point_on_surface.sfc(sf::st_zm(x)): st_point_on_surface may not
give correct results for longitude/latitude data
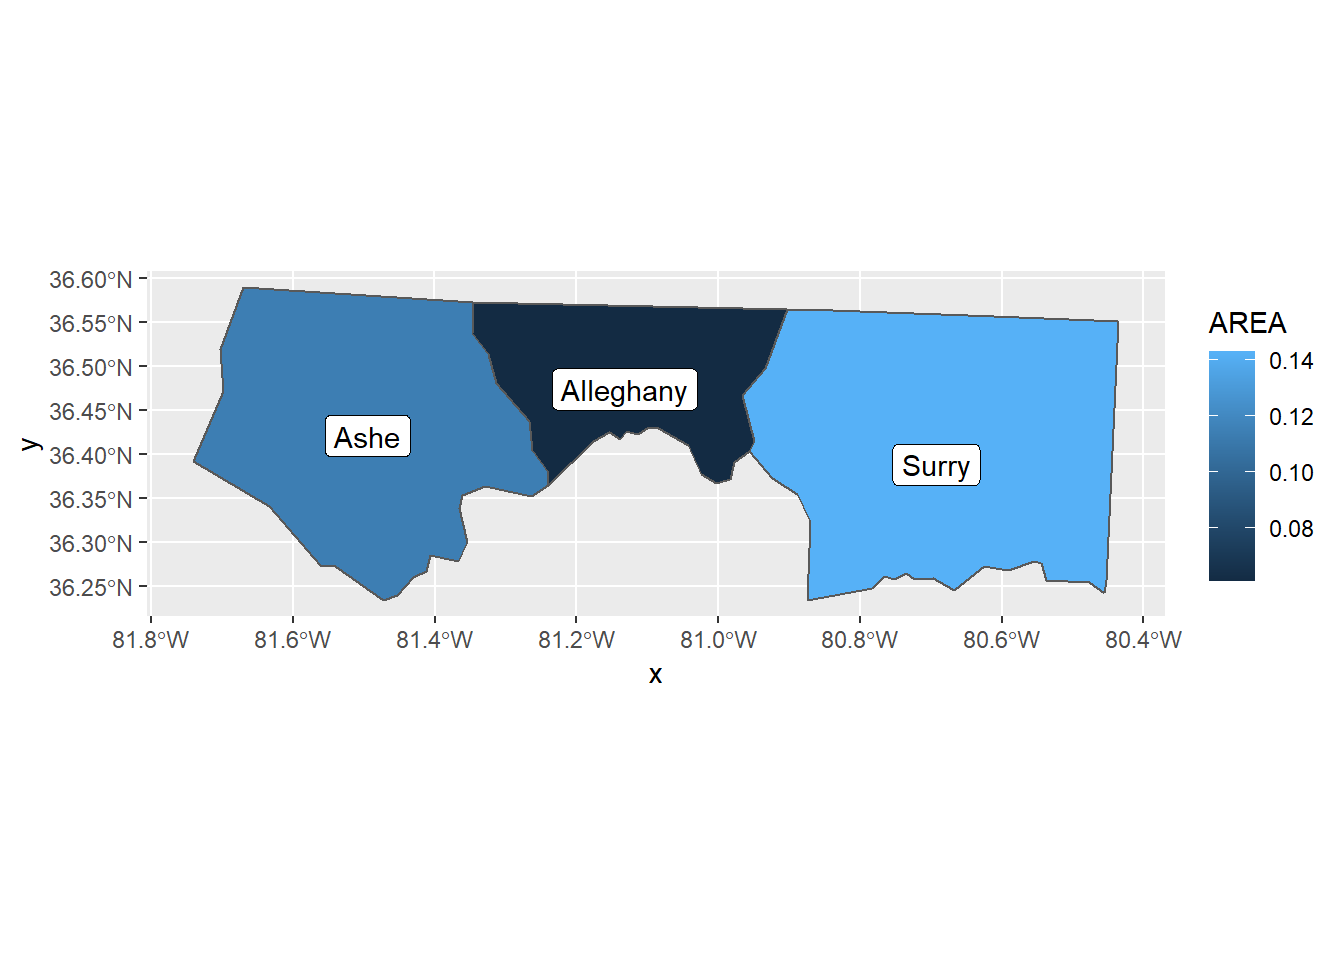
For labels, use geom_sf_label():
p +geom_sf_label(aes(label = NAME))
Warning in st_point_on_surface.sfc(sf::st_zm(x)): st_point_on_surface may not
give correct results for longitude/latitude data
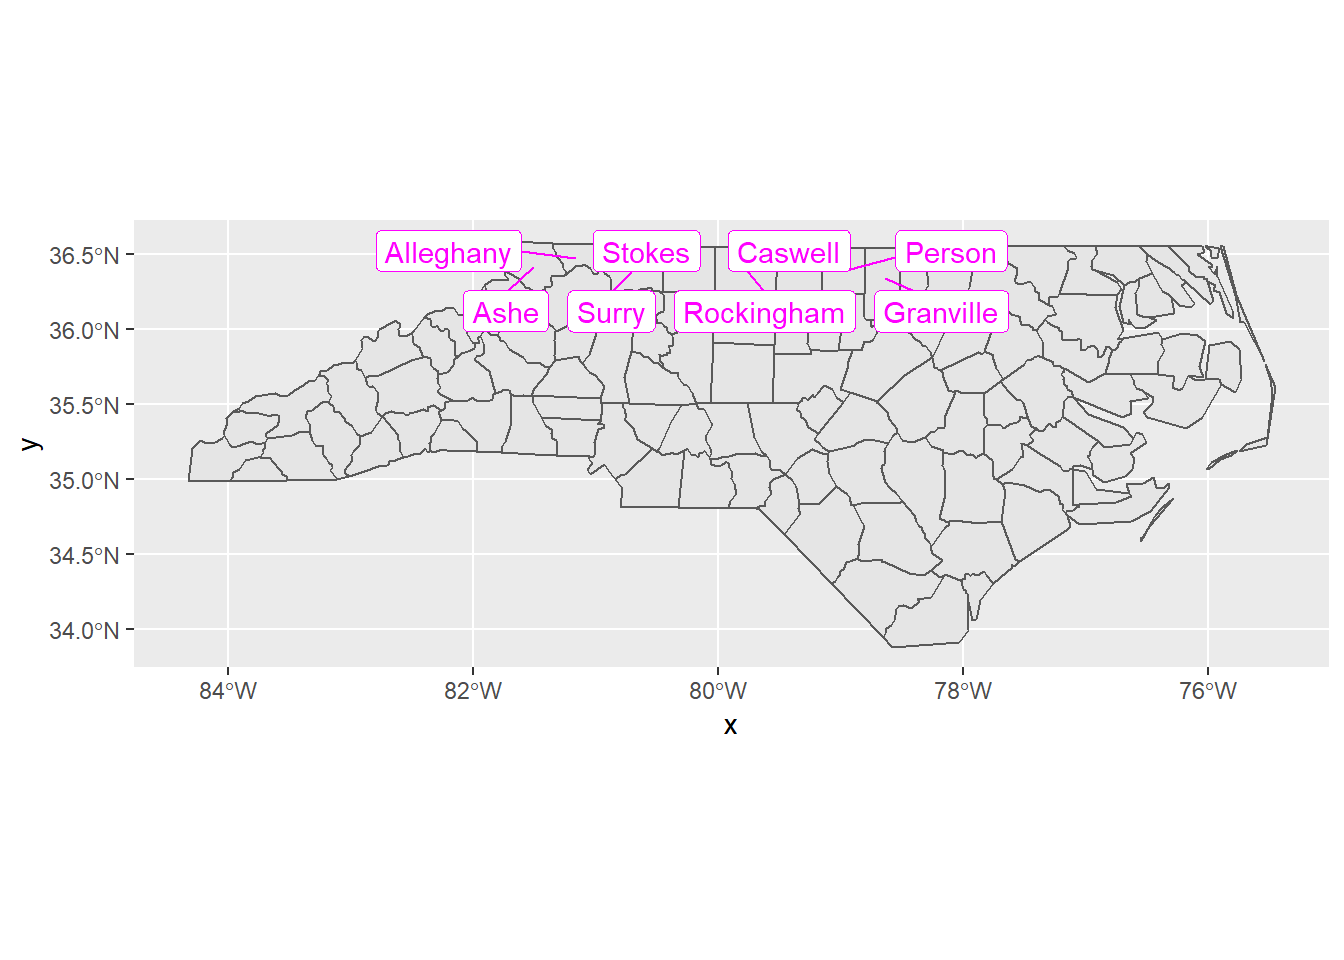
Protip: stat_sf_coordinates()
Under the hood, a Stat called stat_sf_coordinates() does the necessary calculations. If you are an expert of ggplot2, please play with this by combining with other Geoms. As an example, here’s a preliminary version of geom_sf_label_repel() (which I want to implement next…):