A generic function ggplot_add() was added to ggplot2 by this PR:
Allow addition of custom objects by thomasp85 · Pull Request #2309 · tidyverse/ggplot2
I think creating a custom Geom or Stat and its constructor (geom_*() or stat_*()) is enough for the most of the extension packages of ggplot2, but some people, including me, need this.
Why are there no geom_highlight()?
Here is an example code of my package gghighlight:
gghighlight_point(d, aes(foo, bar), predicate = bar > 20 & baz == "A")You may wonder why this can’t be written like this:
ggplot(d, aes(foo, bar)) +
  geom_highlight_point(bar > 20 & baz == "A")
Let me explain a bit.
geom_*()/stat_*() doesn’t know about the other layers
geom_highlight_point(bar > 20 & baz == "A") is passed bar > 20 & baz == "A" without the data d, with which the expression should be evaluated. It needs d specified in ggplot(...).
But, considering the structure of the above code, geom_highlight_point(...) cannot access to the result of ggplot(...) in any usual way:
`+`(ggplot(...), geom_highlight_point(...))If ggplot2 were designed pipe-friendly, this
`%>%`(ggplot(...), geom_highlight_point(...))would be evaluated as this, which means geom_highlight_point(...) could take d from ggplot(...)…
geom_highlight_point(ggplot(...), ...)Anyway, let’s give up here. All I have to do is set this expression as an attribute of a custom Geom and pray that it will be evaluated with the proper data in the phase of building a plot.
Geom*/Stat* doesn’t know about the original data
Take a look at the simplest example in the vignette “Extending ggplot2”:
StatChull <- ggproto("StatChull", Stat,
  compute_group = function(data, scales) {
    data[chull(data$x, data$y), , drop = FALSE]
  },

  required_aes = c("x", "y")
)
You may notice that compute_group() expects data has the fixed column x and y. Actually, data is not the original data but the one the mapping is already applied. So, there is no column bar and baz anymore; bar is renamed to y and baz is dropped. Oh no, I cannot evaluate bar > 20 & baz == "A" here, too…
ggplot_add()
Let’s remember this one:
`+`(ggplot(...), geom_highlight_point(...))Only + (or +.gg) can access to both ggplot(...) and geom_highlight_point(...). This means that, inside +.gg, bar > 20 & baz == "A" can be evaluated.
So…, should I implement my custom +.gg by myself? No, because I will be able to use ggplot_add()!
ggplot_add() is called in +.gg() via add_ggplot() (very confusing..) and is passed both the original plot and the new object. The current implementation is this:
"+.gg" <- function(e1, e2) {
  # Get the name of what was passed in as e2, and pass along so that it
  # can be displayed in error messages
  e2name <- deparse(substitute(e2))

  if      (is.theme(e1))  add_theme(e1, e2, e2name)
  else if (is.ggplot(e1)) add_ggplot(e1, e2, e2name)
  else if (is.ggproto(e1)) {
    stop("Cannot add ggproto objects together.",
         " Did you forget to add this object to a ggplot object?",
         call. = FALSE)
  }
}
(https://github.com/tidyverse/ggplot2/blob/7d0549a03e5ea08c27c768e88d5717f18cb4a5ce/R/plot-construction.r#L40-L52)
add_ggplot <- function(p, object, objectname) {
  if (is.null(object)) return(p)

  p <- plot_clone(p)
  p <- ggplot_add(object, p, objectname)
  set_last_plot(p)
  p
}
(https://github.com/tidyverse/ggplot2/blob/7d0549a03e5ea08c27c768e88d5717f18cb4a5ce/R/plot-construction.r#L59-L66)
By using this, I can implement the proof-of-concept version of geom_highlight_point() as bellow:
geom_highlight_point <- function(expr) {
  structure(list(expr = rlang::enquo(expr)), class = "highlight")
}

ggplot_add.highlight <- function(object, plot, object_name) {
  new_data <- dplyr::filter(plot$data, !! object$expr)
  new_layer <- geom_point(data = new_data,
                          mapping = plot$mapping,
                          colour = alpha("red", 0.5),
                          size = 5)
  plot$layers <- append(plot$layers, new_layer)
  plot
}library(ggplot2)
d <- data.frame(foo = 11:30, bar = 11:30, baz = rep(c("A", "B", "C"), length.out = 20),
stringsAsFactors = FALSE)
ggplot(d, aes(foo, bar)) +
geom_highlight_point(bar > 20 & baz == "A") +
geom_point() # for comparison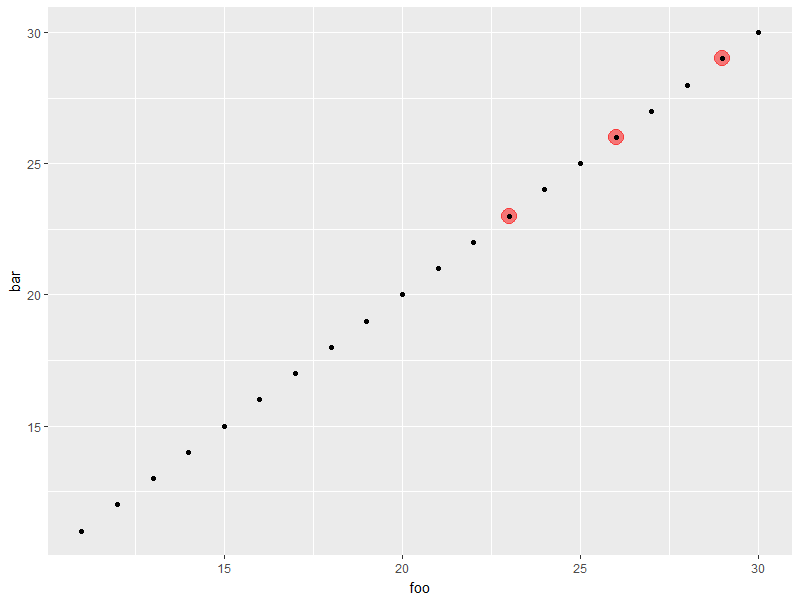
I’m not sure if this is the intended usage of ggplot_add(), but this seems very nice. Looking forward to the next release of ggplot2!